MS Excel
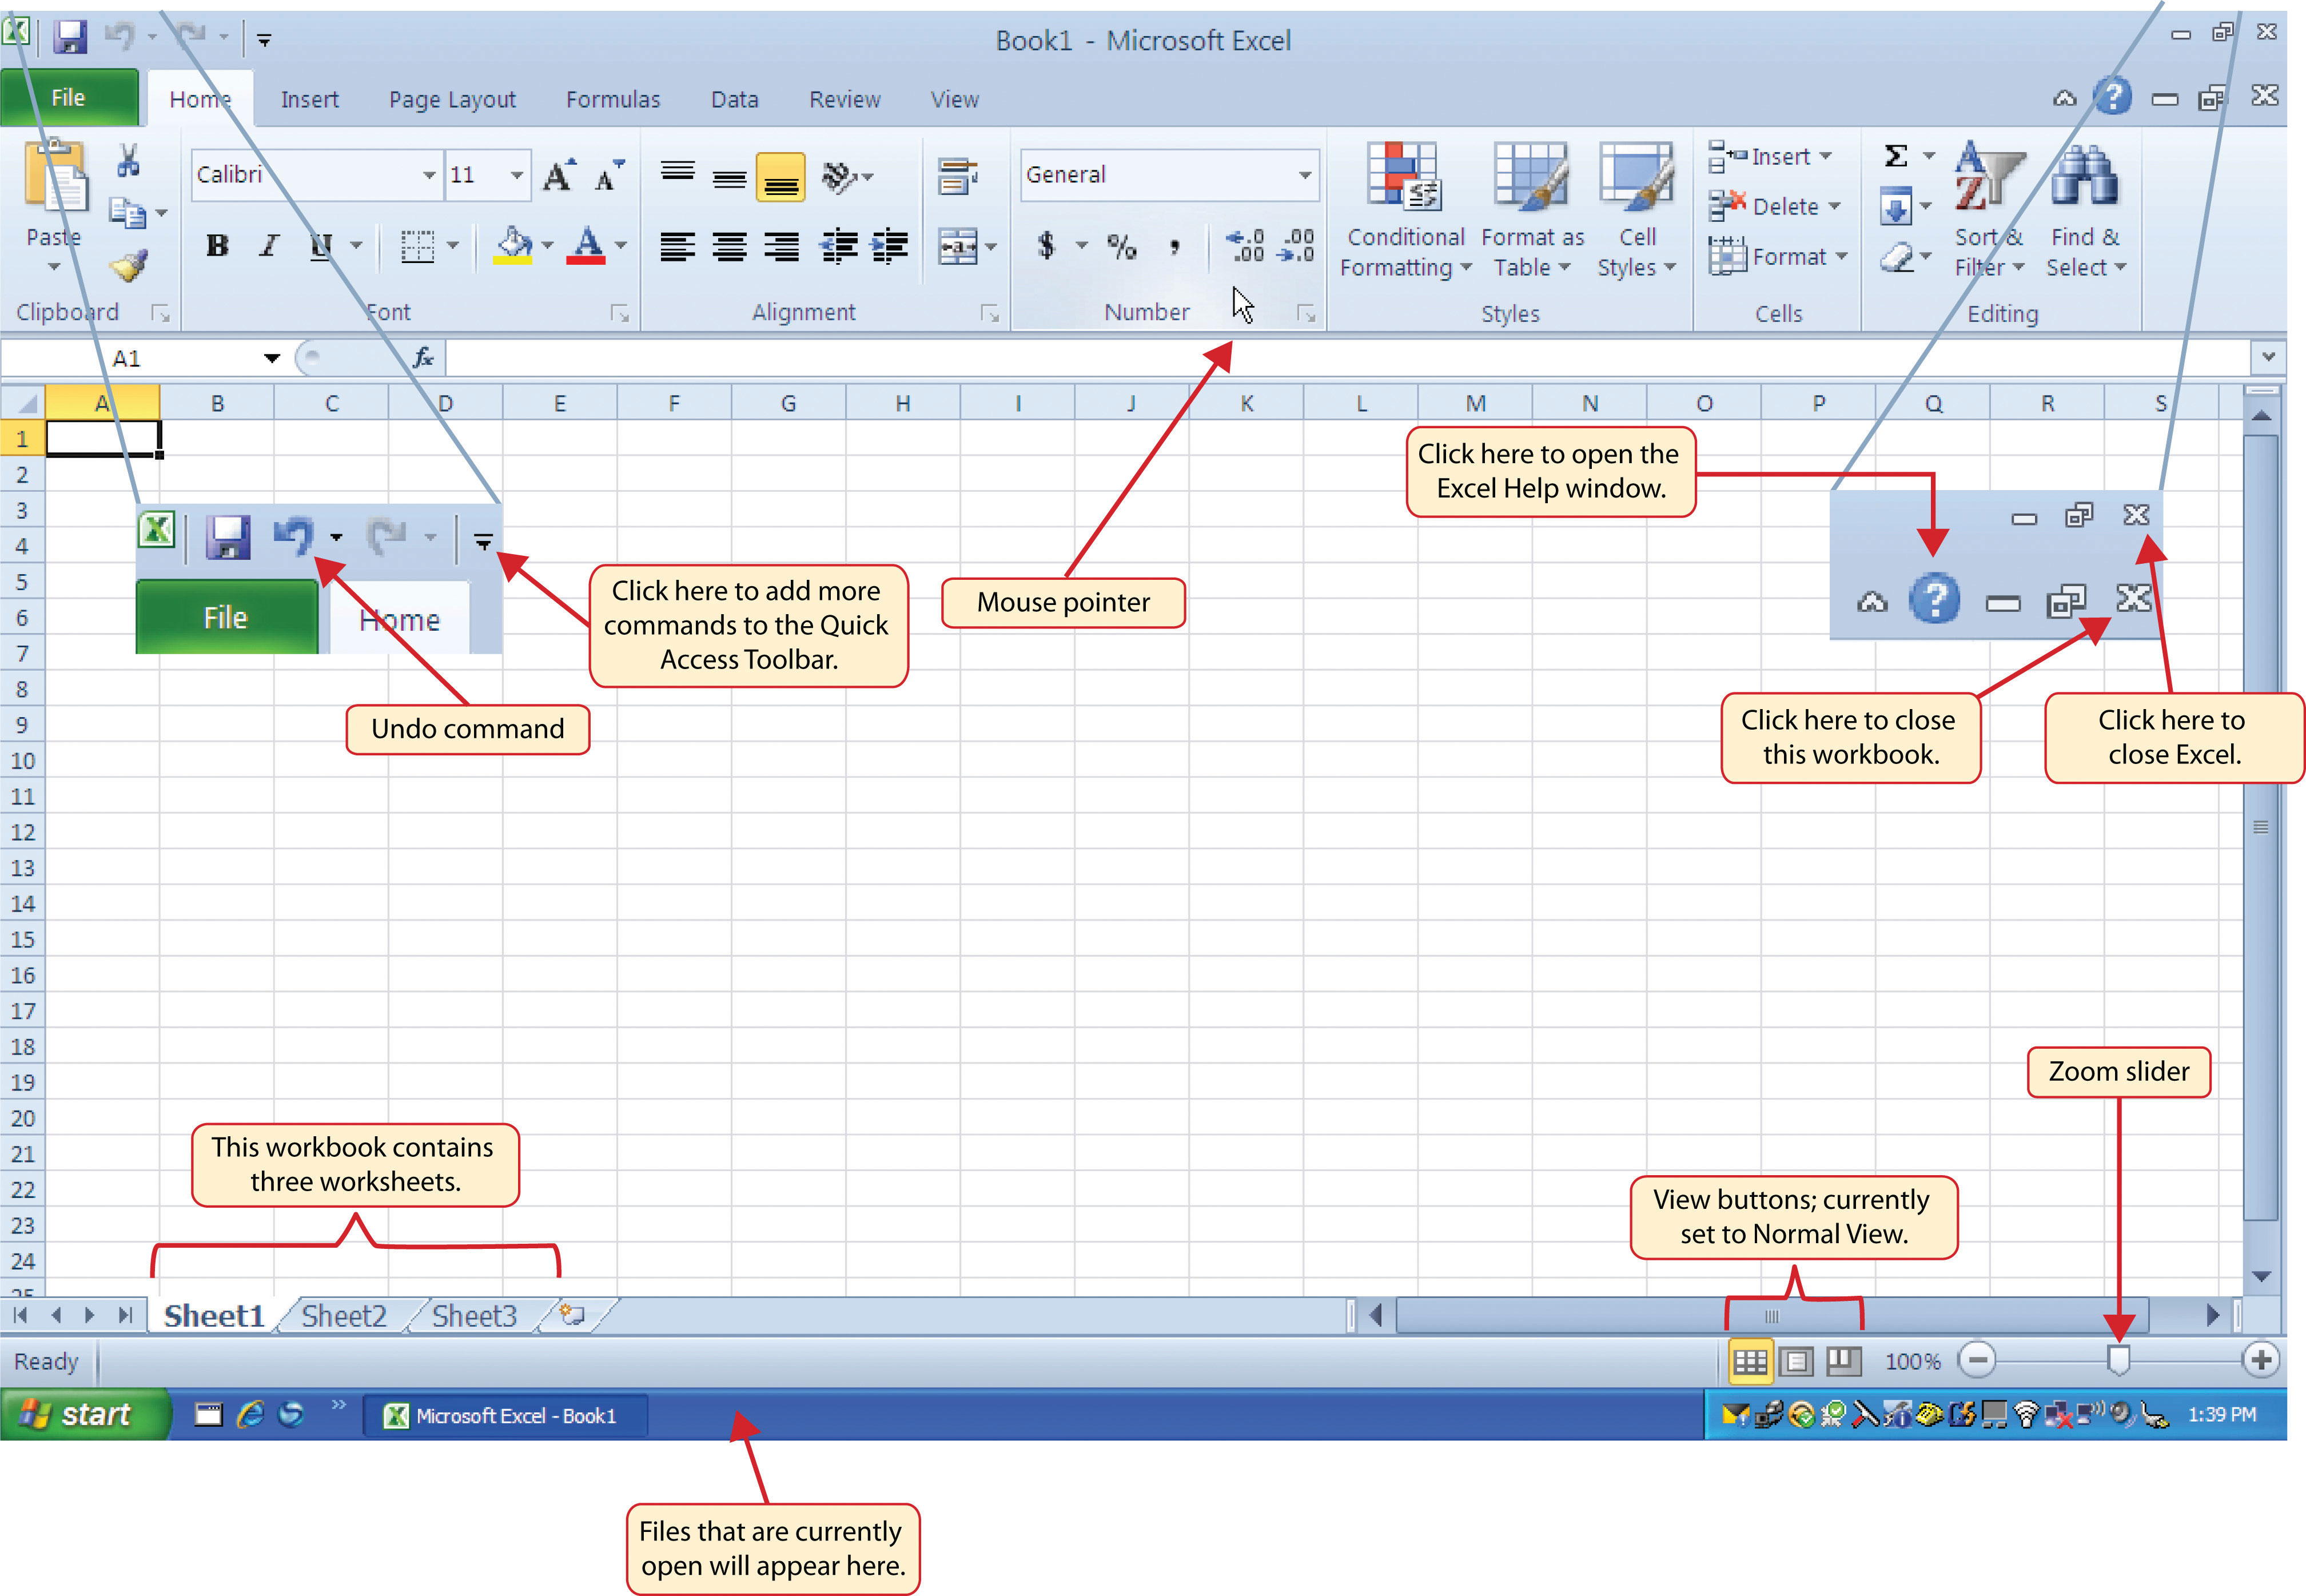
MS-EXCEL is a part of Microsoft Office suite software. It is an electronic spreadsheet with numerous rows and columns, used for organizing data, graphically representing data(s), and performing different calculations.
SUM #Product #Average #MAX #MIN #DATE #TIME #TODAY #NOW #LEFT #RIGHT #MID #LOWER #UPPER #OPER
Sorting / Filtering #Number Formatting #Alignment tools #Data Structuring #Inserting & Deletion Columns / Rows #Format Painter #Inserting Charts #Inserting Illustrations #Define name #Goal Seek #Charts #Freeze Panes
The CONCATENATE function allows you to combine text from different cells into one cell. In our example, we can use it to combine the text in column A and column B to create a combined name in a new column.Before we start writing the function, we'll need to insert a new column in our spreadsheet for this data.
VLOOKUP is a built-in Excel function used to search for a value in the first column of a table range and return a corresponding value from another column in the same row.
Conditional formatting makes it easy to highlight certain values or make particular cells easy to identify. This changes the appearance of a cell range based on a condition (or criteria). You can use conditional formatting to highlight cells that contain values which meet a certain condition.
Conditional formatting is used to change the appearance of cells in a range based on your specified conditions.
The conditions are rules based on specified numerical values or matching text. Changing the appearance of cells can visually highlight interesting data points for analysis. # Professionals have come to depend on Excel for its versatile capabilities in various industries, and the financial sector is no exception. With many robust features and diverse operations, Excel provides an excellent platform for financial research, modeling, and calculations.
This comprehensive guide aims to explore Excel�s powerful financial functions, shedding light on their significance and imparting efficient methods to leverage them for optimizing financial processes.Join us as we delve into the world of Excel�s financial capabilities and unlock their potential for enhanced financial analysis and decision-making. Functions
Text Functions Date/Time Functions Logical Function Maths & Trigonometry Statistical Function Dollar Date If Sum Count Exact Time And Average CountA Left Today If(And : Nested Product CountBlank Mid Now If(Or : Nested Power Countif Right Edate Financial Function Randbetween Large Len Days Future Value Round Up Small Lower Compatibility Function Present Value Round Down Median Upper VAR PMT (EMI) Sumif Min Max Proper Quartile NPER Sumproduct Mean Replace Stdev IPMT Lookup Function Rept Mode PPMT VLookup Substitute PDuration Transpose ISPMT HLookup
Features 1. Charts 2. Sparkline 3. Define Names 4. Trace Precedents / Trace Dependants 5. Show Formulas 6. Scenario Manager 7. Goal Seek 8. Grouping & Ungrouping of data 9. Data Validation 10. Text to Columns 11. Macros 12. Freeze Panes 13. Pivot Table 14. Slicer / Timeline 15. Protect Range in Sheet 16. Protect Sheet / Workbook * So Many Keyboard Short Keys * Working on Tabular & Graphical Data Sets.